
The General Economy
The prospects for a downturn in Q2 2023 evaporated, thanks once again to consumers. According to Fannie Mae, Personal Consumption Expenditures (PCE) grew at an annualized rate of 1.4 percent, leading to an annualized Gross Domestic Product (GDP) improvement of 1.0 percent. But the economy sent mixed signals all quarter long.
Although headlines across the nation reported layoffs, job creation was robust and broad, and unemployment edged up to only 3.6 percent in June. Inflation, as measured by the Consumer Price Index (CPI), averaged 4.1 percent for the quarter and hovered above the 2 percent target, but lower prices at the pump made it less painful. People showed more price sensitivity but were determined to travel, pushing hotel rates1 up 16 percent above pre-pandemic levels.
Many COVID-related benefits expired this quarter and household debt service ratios2 hovered close to pre-pandemic levels, but real earnings increases returned. Moreover, according to the Federal Reserve Bank of San Francisco, there were $500 billion in excess savings spread among all income levels. Personal balance sheets were buoyed with the highest levels of savings interest rates in years and there was a rebound in the stock market. According to the National Association of Home Builders (NAHB), a less hospitable lending environment was felt in the construction industry, but business investment and manufacturing performed well in spite of it. A recent survey on lending practices by the Atlanta Federal Reserve showed that many businesses were not looking to borrow; they had enough cash or other funding sources to finance their needs.
The Real Estate Sector
Residential
The housing market posted a small recovery in Q2 2023. The Mortgage Bankers Association (MBA)’s June Finance Forecast projected a 1.0 percent improvement in existing home sales and a 6.8 percent improvement in new home sales. The number of originations rebounded. Buyer interest barely flagged, due to millennials aging into the prime home-buying years and the supportive employment situation. Unfortunately, the traditional spring buying season was hampered by a formidable lack of inventory and 30-year fixed mortgage rates that have lingered above 6.5 percent since late May. In April, Realtor.com reported that 82 percent of potential sellers felt “locked in” to their relatively low mortgages, making it economically unwise to move. This led to a lack of existing homes for sale. According to NAHB, over 30 percent of all sales in March were new homes, compared to an estimated 13 percent from 2000 through 2019.

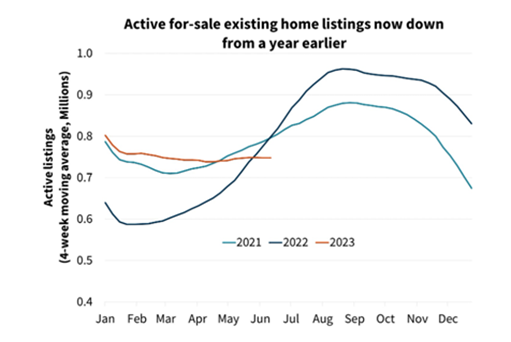
Source: Fannie Mae
Home prices ticked up sooner than expected this quarter, reflecting enduring demand, the lack of housing supply and the fact that the median price of a new home was about 18 percent more than an existing one. The Federal Housing Finance Agency’s Housing Price Index (FHFA HPI) moved up every month this year; April showed a year-to-year 3.1 percent advancement. Most of the U.S. experienced price growth, especially in the East South Central (comprising Alabama, Kentucky, Mississippi and Tennessee) and New England regions. With higher prices, smoother supply chains and healthy new home sales, builder confidence skipped into positive territory and single-family starts for the quarter leapt 5.3 percent.
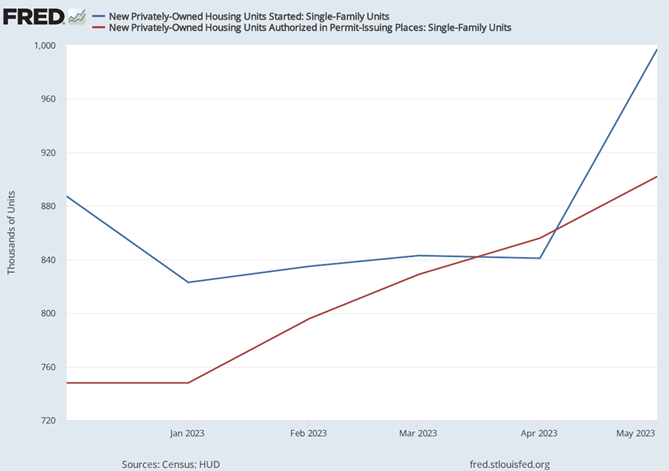
Source: Federal Reserve Bank of St. Louis3
Commercial
The commercial market was constricted by the financial environment this quarter. Total transactions in May were down 61 percent compared to the same time last year, and the declines were across all asset classes, according to MSCI. Price adjustment continued; the annualized RCA CPPI National All-Property Index was off 9.4 percent in April and declined to 11.2 percent in May. Rising interest rates eroded investment profitability. In addition, banks’ appetites for CRE exposure dwindled as they actively worked to improve their balance sheets and liquidity positions in light of intensified Federal Deposit Insurance Corporation (FDIC) scrutiny.
The sector generating the most attention was Office because of its weakening fundamentals. According to JLL, office vacancies in Q1 2023 were 49 basis points higher than a year before and a number of loans are maturing in the next 20 months. A recent analysis by MSCI shows that the Office sector has the second-highest dollar value of current distressed properties and the most assets in potential distress. Market participants are watching San Francisco closely to see what could unfold for central business districts nationwide. The Bay Area is concentrated in the tech field – a highly remote work industry – and recently grabbed headlines with distress in hotel, retail and office properties.
Other sectors’ fundamentals stayed relatively solid. The travel boom supported the hotel and retail industry, especially in travel destinations. Hotel transaction prices were up 1.8 percent in the last year, the only sector that showed a gain, per MSCI. Despite concerns about lower rental growth rates and increased inventory, multifamily units also remained in demand with home affordability stubbornly low. Industrial space attractiveness, which moderated from soaring levels last year, was very dynamic. Per JLL, commercial markets in the Southwest and Southeast showed high net absorption and construction activity. Data centers, written off with the collapse of cryptocurrency, were reinvigorated from the surge in artificial intelligence (AI) programming.
A Forward Glance
Projections for a recession in the second half of this year persist, but the intensity has softened.
Fannie Mae expects that annualized GDP growth will falter only 0.3 percent in Q3 2023. With unemployment creeping up and loan standards staying tight this quarter, the downward pressures on the economy may mount. Moreover, The Federal Reserve (the Fed) was clear in its June comments that it is committed to cooling the economy further. It paused rate increases in June to observe the full impact of its changes over the past year and how much the contraction of credit stifles business expansion. Weak or nonexistent retrenchment in wage growth, prices and employment portend further upward movement in the Federal Funds Effective Rate this year, as early as July.
A slowing economy could bring a small dip in the housing market, with home sales and median home prices (both new and existing) edging down. In commercial real estate, declines in transactions and prices could endure if restrictive financing conditions persist. A steadier stream of distressed properties may come to market, allowing for further market correction, particularly in the Office sector. However, JLL believes we may have already reached the bottom of office occupancy rates, as job creation is so robust. The next quarter likely will offer another mixed bag that confounds forecasters.
1 Copyright ©2023 “Commercial Market Insights Report April 2023.” NATIONAL ASSOCIATION OF REALTORS®. All rights reserved. Reprinted with permission. July 2023, https://cdn.nar.realtor/sites/default/files/documents/2023-04_commercial_market_insights_report_04-28-2023.pdf?_gl=1*jve80d*_gcl_au*MjEwNDI1NzI2My4xNjgyOTQ5MzU5.
2 Board of Governors of the Federal Reserve System (US), Household Debt Service Payments as a Percent of Disposable Personal Income [TDSP], retrieved from FRED, Federal Reserve Bank of St. Louis; https://fred.stlouisfed.org/series/TDSP, July 4, 2023.
3 U.S. Census Bureau and U.S. Department of Housing and Urban Development, New Privately-Owned Housing Units Authorized in Permit-Issuing Places: Single-Family Units [PERMIT1], retrieved from FRED, Federal Reserve Bank of St. Louis; https://fred.stlouisfed.org/graph/?g=16V4j, July 10, 2023.