
MARKET OVERVIEW
At first glance, the commercial real estate market in Q1 2024 is a dreary continuation of 2023. But there are small signs of a clearer outlook. Transactions for the major asset types ended 2023 at just over $230B and were on pace mid-quarter to be down 41% compared to last year, according to CoStar data. However, this is an improvement over the last two quarters, when volume slumped by 56.2%. Market cap rates rises tapered off for Industrial and Retail a few quarters ago and the same appears to be happening for Office and Retail this quarter. Price declines had all but halted in January, off only 0.1% on a month-to-month basis, with Apartment weighing down the average.
The underlying market sentiment seems to be warmer as well. Quite a few new or larger market funds were announced in the last few months, some to target potential distressed properties. In addition, JLL reports that dry powder for commercial real estate investment is estimated at over $400B globally, with the U.S. as its primary target.
If interest rates fall this year as expected, most sector’s fundamentals should encourage deal making. Industrial property rent growth was about 12% in 2023, despite new deliveries that pushed up vacancy rates. Retail had a very good holiday season and vacancies* hit a 10 year low at the end of 2023 at just 4.1%. Apartment rent gains have been held back by the continued wave of new units. But mortgage rates bumping around in the high 6’s are keeping people in apartments, supporting demand.
Office prospects remain cloudy as the sector undergoes deep structural change. The likelihood of distress sales has climbed. According to the Mortgage Bankers Association, office property delinquencies jumped 1.4% in Q4 2023. According to MSCI’s distress tracker**, Office accounted for 41% of 2023’s cumulative distressed value.
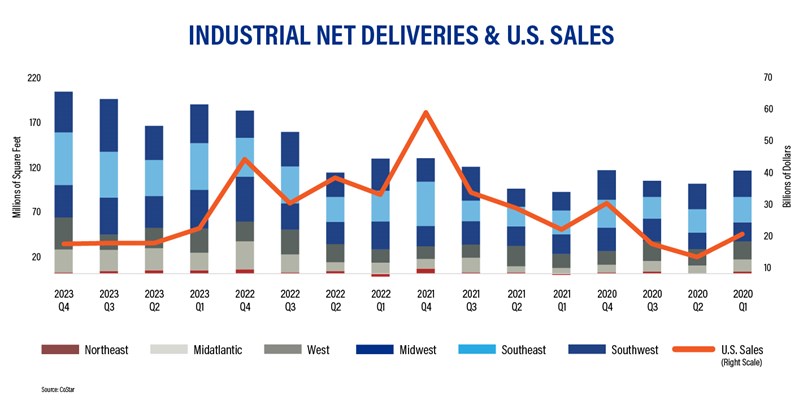
A CLOSER LOOK – INDUSTRIAL DELIVERIES
Historically high deliveries of industrial space have reportedly softened investor’s appetite. But as the graph below reveals, the correlation between inventory and deal volume has lessened, starting in 2022. Prior to this, supply and demand were in better balance, and the rise and fall of deliveries and sales mirrored each other. Since the Federal Reserve began raising its rate in March 2022, it became the determining factor for transaction activity.
The same disconnect is true at the regional level. There was significant variability in the trend for deliveries across regions, yet all experienced a downturn in transaction volume in 2023. In particular, the Southeast’s tempo of development rose for three of the four quarters. According to CoStar, Atlanta, Georgia and Charlotte, North Carolina represented two of the top 15 markets in terms of square footage in the U.S., and both boosted their inventory by approximately 3% in the last year. The Northeast, on the other hand, experienced a slower pace of deliveries all year. New York’s steady expansion was offset by smaller New England markets, including Boston, Massachusetts.
WHAT’S NEXT?
Stay tuned for next month’s Economic Update Q1 2024 to see how the quarter ends.
*Copyright© 2024 “December 2023 Commercial Market Insights Report.” NATIONAL ASSOCIATION OF REALTORS®. All rights reserved. Reprinted with permission. March 2024, https://www.nar.realtor/commercial-real-estate-market-insights/december-2023-commercial-real-estate-market-insights
**MSCI Real Capital Analytics, MSCI Mortgage Debt Intelligence