
The economy grew 2.2% in Q1, generously helped by catch-up government spending after the October 2025 shutdown. While inflation at 2.8% remains a key metric to monitor, the labor market continues to exhibit a sense of equilibrium. The Federal Reserve (the Fed) was in “wait and see” mode; the anticipated inflationary fallout from the Iran War could mean only one 2026 rate cut.
The residential housing market environment was favorable compared to last year and rates sliding below 6% in February fueled activity. However, a combination of lingering economic concerns, unseasonable weather, and a late-quarter rebound in interest rates ultimately dampened performance, leading to a more subdued result. Commercial Real Estate (CRE) fundamentals continued to normalize broadly, supported by economic momentum and relatively little new space delivered. Transaction volume projected to be $65 billion was a strong start to the year.
Residential Real Estate
A warming thaw in affordability1 was welcomed in February but the month was bookended by inhospitable weather and a chilling resurgence in mortgage rates. The cumulative result was flat quarterly growth in Existing Sales, and faltering Single-Family Starts and New Home Sales. Builders dealt with storms, tariff-driven construction costs, and almost 10 months’ worth of new homes unsold. Persistent economic concerns, followed by the war in Iran, fed buyer hesitancy.
The soft housing figures overshadowed a market that was more attractive than a year ago. According to Realtor.com, New and Active Listings were ahead of 2025’s pace. A tame FHFA Home Price Index of 0.9% (compared to 4.3% in Q1 2025) was evident in more attractive prices for both new and existing homes. Moreover, despite a surge at the end of March, the quarterly 30-Year Fixed Rate Mortgage tumbled 70 basis points (bp) in one year. These conditions enticed committed buyers. In mid-March, the Mortgage Bankers Association (MBA) noted, “The pace of homebuying continues to track ahead of last year’s pace, with overall purchase volume up 10%. More inventory on the market is supporting more transactions.” Borrowers also took advantage of lower rates, with refinancings accounting for 40% of originations.
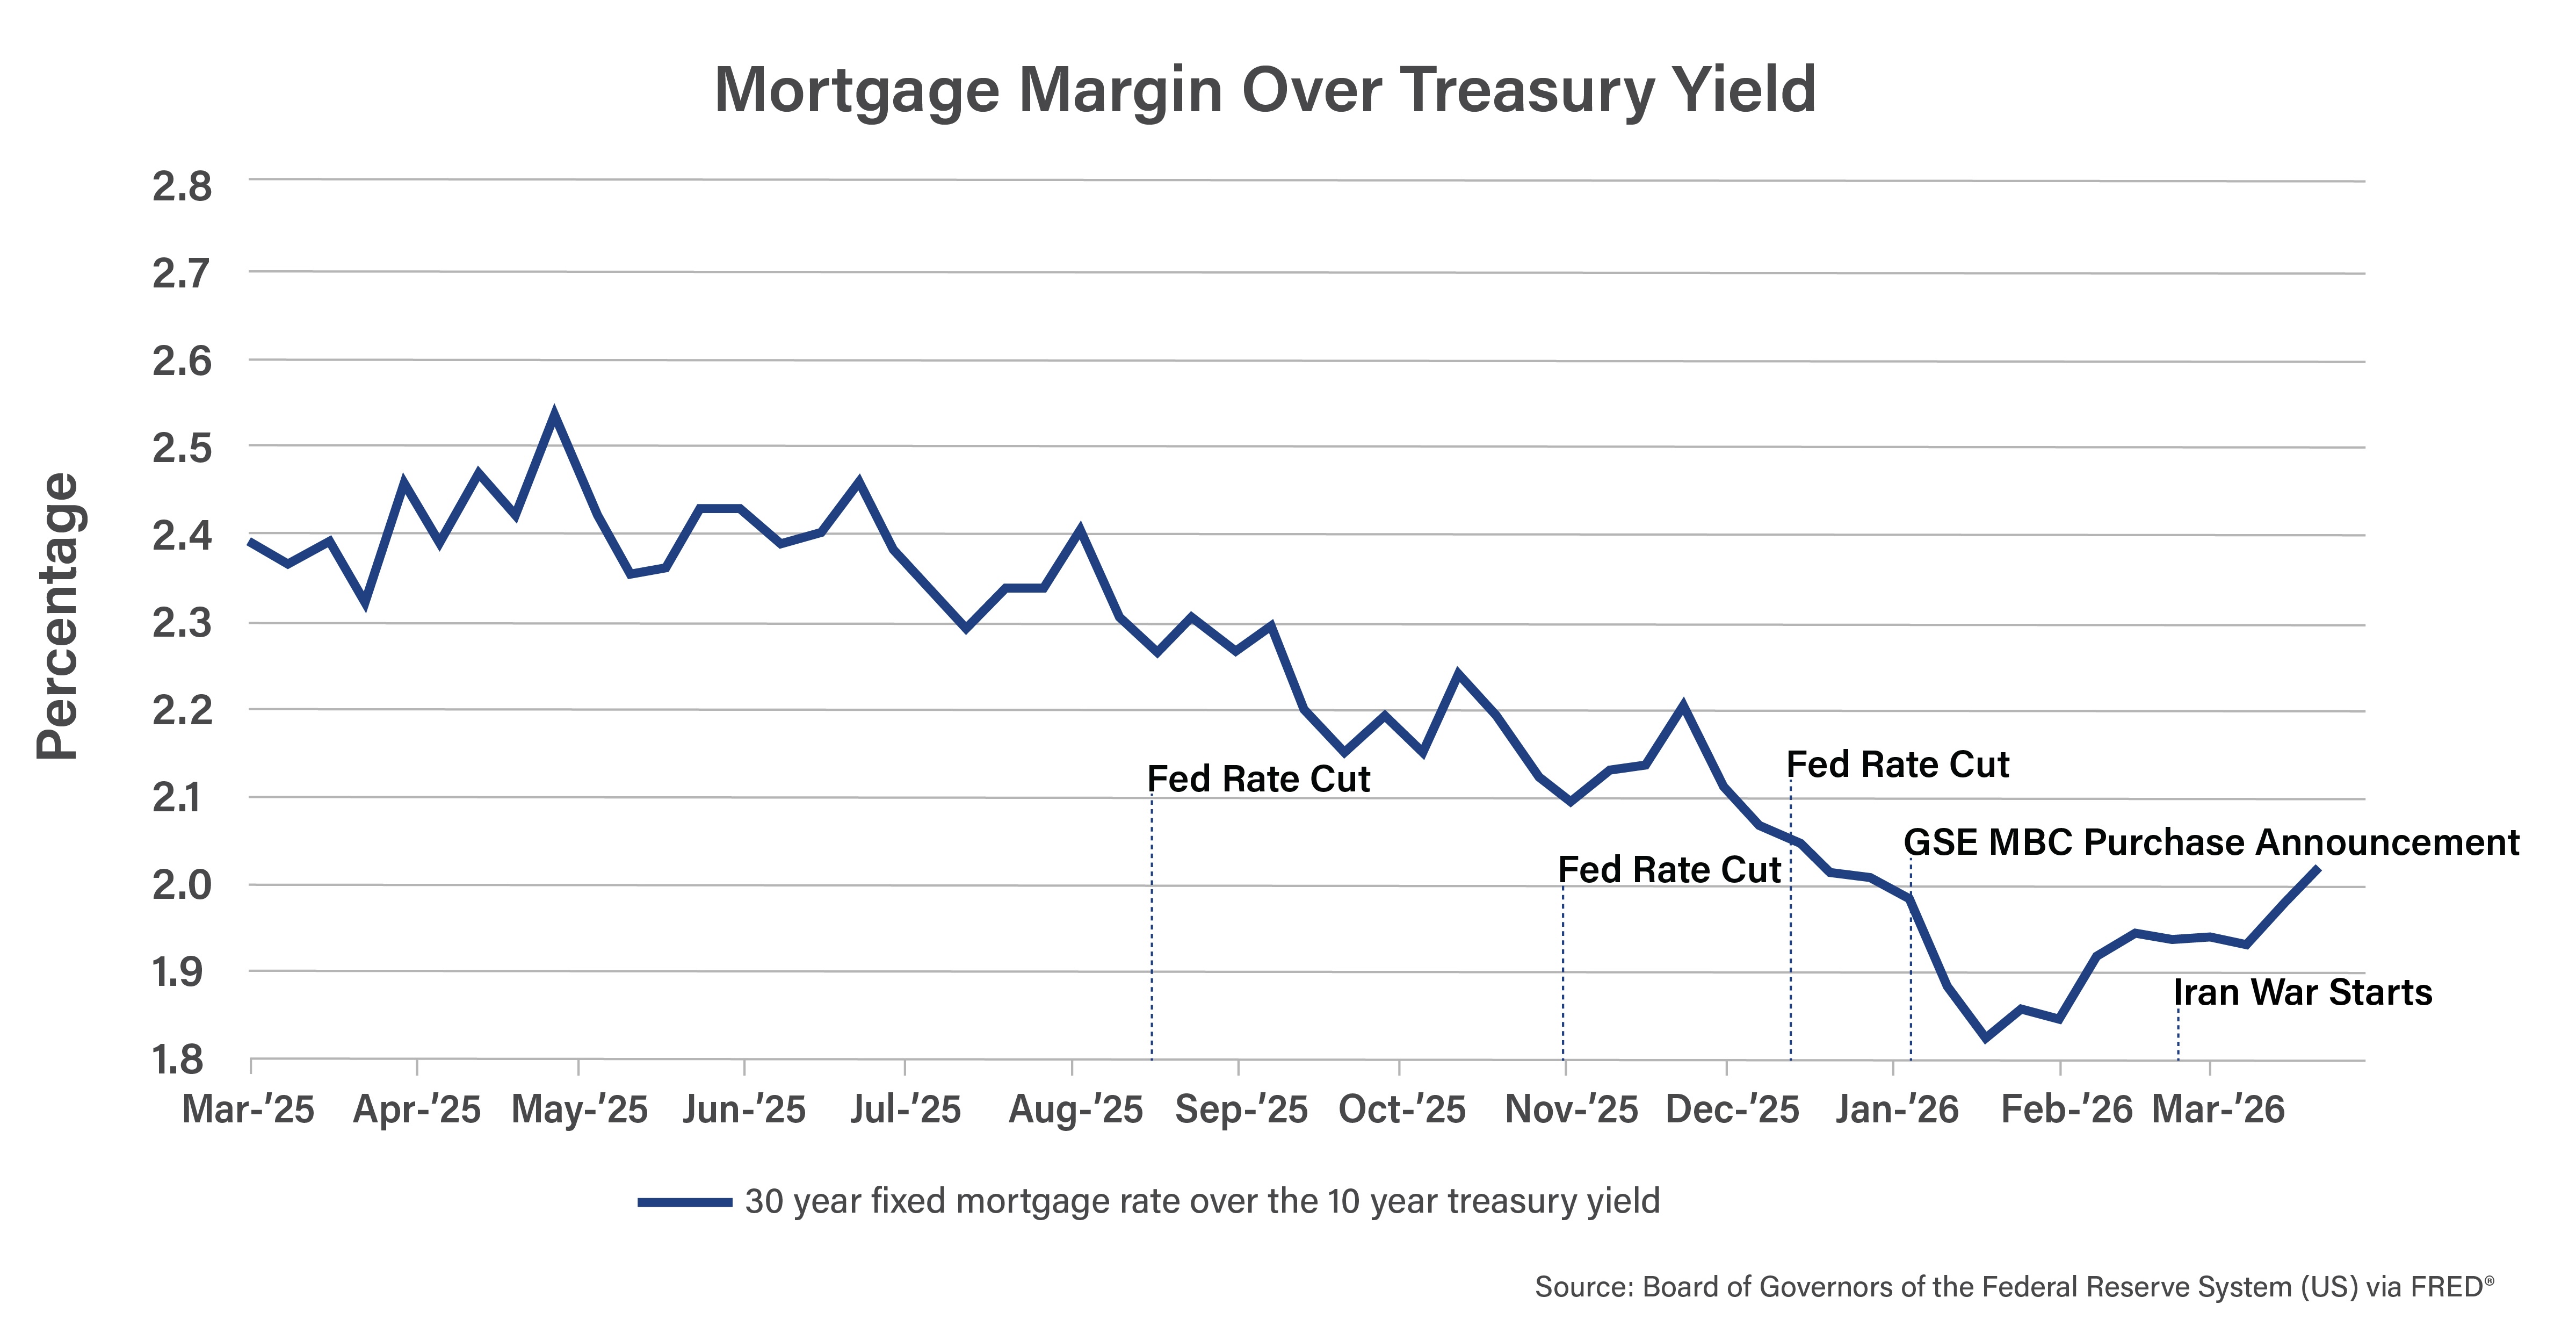
The volatility in mortgage rates was driven not only by fluctuations in the benchmark 10-year Treasury yield2 but also by shifts in the risk and profit margins applied by lenders. The margin dipped with each Fed rate cut, showing greater confidence in its inflation management. The president’s announcement3 that Freddie Mac and Fannie Mae would purchase $200 billion of mortgage-backed securities potentially lowered banks’ funding costs and shrunk the margin significantly. Good inflation news in February pushed the spread closer to its historical average of 180bp, bringing the 30-Year Fixed Rate below the psychological barrier of 6% to 5.98% at month’s end. Since then, the uncertainty wrought by war, the surging price of oil, and presumed subsequent inflation forced the margin back to 200bp.
Commercial Real Estate
CRE was off to its best start in three years, with transaction volume of the four major asset groups on pace to exceed $65 billion, according to CoStar data. Although 12-month volume growth was modest, office activity jumped over 30%. Trade momentum was supported by dropping benchmark rates, compressed spreads, and healthy lender appetite.
The CoStar Commercial Repeat-Sales Index maintained its upward trajectory through February, posting a 1.7% gain for its second consecutive month of growth. Complementing this modest appreciation, capitalization rates remained steady throughout the quarter, signaling a period of relative stability in asset pricing. Across all types of financing, delinquencies fell in February, signaling the distress cycle may be winding down. Lenders sustained support for modifications and extensions kept distress deal volume low.
JLL’s Global Bid Intensity Index4 revealed a very competitive environment and players remained stalwart in the face of a new war. “While the Middle East conflict has the potential to lead to further market uncertainty, given the generally healthy economic fundamentals, we anticipate an intensifying capital markets liquidity cycle in 2026,” JLL’s Capital Markets CEO said. Office benefited from not only an anemic construction pipeline, but also from the removal of nearly 40 million square feet of inventory, according to the latest CoStar sector report. Consequently, January’s vacancy5 at 14% drifted down from its expected apex and annual rent growth once again was over 1%.
Industrial’s fundamentals continued to reflect the sector’s retreat from its speculative building phase, with vacancies rising to 7.5% and rents softening. Looking ahead, however, net absorption6 is projected to increase by 20% in the first half of 2026, compared to the second half of 2025. This outlook is partly supported by the data center boom, which is driving demand for ancillary industrial space.
Data center development is evolving as AI companies shift their focus from energy-intensive training models to serving real-time user demand through inference. These workloads are typically less power-hungry and, in many cases, benefit from being located closer to population centers.
Selective new supply put slight pressure on Retail’s vacancy and rental growth rates. Retail continues to adapt to customer tastes, as exemplified by ‘90s-loving Gen Z’s delighted discovery of the shopping mall.
Multifamily is working through inventory, with vacancy and annual rents reflecting low absorption in overbuilt markets. But demand held steady, thanks to a favorable mortgage to rent margin7 of over 36% in Q4 2025. Builder-friendly government directives8 and a 20% increase in the FHFA multifamily loan cap prompted positivity among developers. Multifamily starts have been climbing since last September and exploded by 56.9% annually in January.
A Glance Forward
Strong, AI-driven business investment is expected to support another solid quarter of economic growth in Q2 2026. At the same time, the Consumer Price Index is projected to rise 1% as higher energy costs ripple through a broader range of goods and services. In response, the Fed is now broadly signaling a single rate cut later in the year.
Spring residential sales are expected to bounce back, supported by meager house price growth and modest addition of new homes. The MBA forecasts mortgage rates and the spread over treasuries to hold steady. According to Bisnow, there may be some positive impact from the ROAD to Housing Act9, one of the most sweeping housing bills in a decade.
While the recent rebound in interest rates and geopolitical tensions in the Middle East may temper CRE transaction volume, investors may pivot toward tangible assets as a strategic hedge against inflation and global instability. Ultimately, the duration of these conflicts remains a critical variable that could cloud an otherwise optimistic outlook for the coming quarter.
Sources:
1 Copyright ©2026 “National Association of REALTORS: Housing Affordability Index.” NATIONAL ASSOCIATION OF REALTORS®. All rights reserved. Reprinted with permission April 2026. https://www.nar.realtor/commercial-real-estate-market-insights/february-2026-commercial-real-estate-market-insights
2 Board of Governors of the Federal Reserve System (US), Market Yield on U.S. Treasury Securities at 10-Year Constant Maturity, Quoted on an Investment Basis [DGS10], retrieved from FRED, Federal Reserve Bank of St. Louis; https://fred.stlouisfed.org/series/DGS10, April 6, 2026.
3 Copyright ©2026 “Washington Report: President Trump Directs MBS Purchases to National Lower Mortgage Rates.” NATIONAL ASSOCIATION OF REALTORS®. All rights reserved. Reprinted with permission April 2026. https://www.nar.realtor/washington-report/president-trump-directs-mbs-purchases-to-lower-mortgage-rates
4 Bisnow, “Heated Rivalries Hold Up Bid Intensity as More Properties Come to Market.” Reprinted with permission April 2026.
5 Copyright ©2026 “February 2026 Commercial Real Estate Market Insights.” NATIONAL ASSOCIATION OF REALTORS®. All rights reserved. Reprinted with permission April 2026. https://www.nar.realtor/commercial-real-estate-market-insights/february-2026-commercial-real-estate-market-insights
6 NAIOP Research Foundation, “Industrial Space Demand Forecast, First Quarter 2026.” Reprinted with permission April 2026.
7 Avison Young, “Q4 2025 U.S. multifamily market overview.” Reprinted with permission April 2026.
8 Bisnow, “Trump Pushes to Deregulate Housing Development With Executive Orders.” Reprinted with permission April 2026.
9 Bisnow, “How the Biggest Housing Bill in Decades Would Spur Development, Despite Contentious BTR Rules.” Reprinted with permission April 2026.